
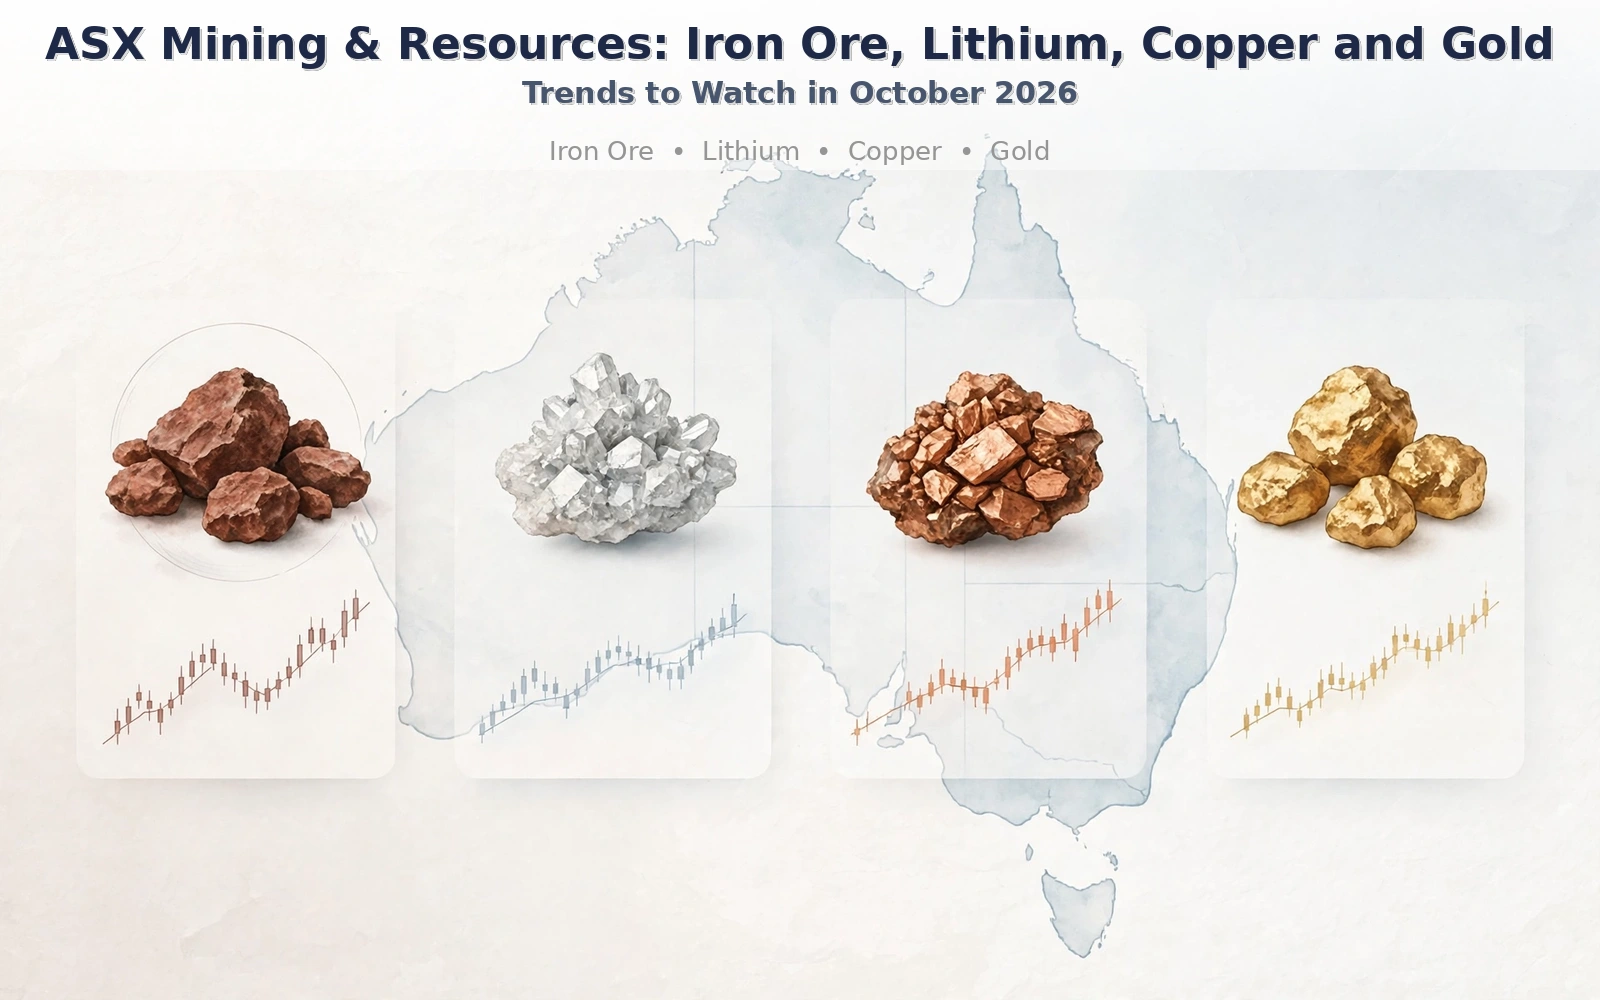
Australia's mining and resources sector enters late October 2026 with diverging commodity trends. Iron ore faces pressure from expanding supply and subdued Chinese steel demand, lithium has retreated from its recent recovery highs, copper continues to benefit from structural demand, and gold remains supported by its role as a defensive asset despite price volatility
Introduction
Australia's mining and resources sector enters late October 2026 with diverging commodity trends. Iron ore faces pressure from expanding supply and subdued Chinese steel demand, lithium has retreated from its recent recovery highs, copper continues to benefit from structural demand, and gold remains supported by its role as a defensive asset despite price volatility.
The latest Australian Government Resources and Energy Quarterly, published in October 2026, forecasts total Australian resources and energy export earnings of approximately A$422 billion in 2026–27, up from A$403 billion in 2025–26. However, aggregate export earnings conceal substantial differences between individual commodities.
For ASX-listed miners, the central question is how commodity prices, production volumes, operating costs and capital expenditure interact to determine financial performance. Companies with diversified operations face different exposures from specialist producers, while exploration-stage businesses depend more heavily on funding, project development and geological results.
Macro Drivers & Headwinds
China, Steel Demand and Iron Ore Supply
China remains central to Australia's iron ore export market. However, its property-sector weakness, subdued construction activity and pressure on steelmakers' margins have created headwinds for demand.
According to S&P Global Energy's October 20 market review, the Platts iron ore benchmark averaged US$96.90 per dry metric tonne in the September quarter, down from US$105 in the June quarter. Ample seaborne supply and production restraint among Chinese steelmakers are expected to weigh on the market during the final quarter of 2026.
Supply growth is another important consideration. Rio Tinto reported that its Simandou iron ore project in Guinea reached an annualised production rate of approximately 10 million tonnes during the September quarter. The project is expected to increase its production run rate as development progresses, adding to competition in the global seaborne market.
China's purchasing strategy also matters. Reuters reported on October 25 that China Mineral Resources Group was seeking more favourable purchasing terms from Australian suppliers, adding a commercial dimension to the existing supply-demand imbalance.
Interest Rates, Inflation and Currency Movements
Interest rates influence mining through financing costs, project valuations and global economic activity. Higher borrowing costs can delay capital-intensive developments, while weaker rates may support investment and industrial demand.
The Australian dollar is another important variable. Many commodities are priced internationally in US dollars, whereas Australian miners incur substantial costs in Australian dollars. Currency movements can therefore affect realised revenue, operating margins and the cost of imported equipment.
Fuel, electricity, labour, maintenance and freight expenses remain important headwinds. Even when commodity prices rise, production costs can limit the resulting improvement in profitability.
Energy Transition and Critical Minerals Policy
Electrification, renewable energy, battery storage and data-centre construction support long-term demand for copper and selected battery materials. However, demand growth does not guarantee higher prices because new mines, processing facilities and technological changes can alter supply conditions.
Geopolitical competition is also influencing critical minerals. On October 27, Reuters reported that the European Union expected substantial investment in Australia's critical minerals sector as it sought to diversify supply chains. Potential investment could extend beyond extraction into processing and refining.
Sub-Sector Breakdown
Iron Ore
Iron ore remains a major contributor to Australia's resources export earnings. Its near-term outlook depends on Chinese steel production, port inventories, seaborne supply and producer costs.
The Australian Government forecasts iron ore export earnings of A$107 billion in 2026–27, declining to A$96 billion in 2027–28 in real terms. The longer-term projection reflects expected price pressure as supply expands and demand growth moderates.
Key indicators include benchmark prices, shipment volumes, freight rates, steel production and the pace of new supply from Guinea.
Lithium and Battery Materials
Lithium's recovery has encountered renewed volatility. Market reporting published on October 23 indicated that China's lithium carbonate futures had fallen approximately 55% from their May peak, while Australian spodumene concentrate prices had declined around 48% from their peak. These figures illustrate how quickly sentiment can change when expectations for battery demand and supply shift.
The longer-term demand picture remains linked to electric vehicles and battery energy storage systems. Government projections anticipate global lithium demand growing faster than supply through 2031, although the market is expected to remain oversupplied in the near term.
Production costs, inventory levels, Chinese processing capacity and new project commissioning will remain central indicators.
Copper
Copper has a distinct demand profile because it is essential to electricity networks, renewable energy infrastructure, electric vehicles and data centres.
The Australian Government reported that London Metal Exchange copper prices exceeded US$14,700 per tonne in early September 2026 amid supply constraints and strong US import demand. It forecasts average prices of approximately US$13,570 per tonne in 2027, reflecting expectations of continued demand alongside constrained mine supply.
Nevertheless, tariff uncertainty, economic weakness and disruptions at individual mines can produce substantial short-term price movements.
Gold and Other Critical Minerals
Gold benefits from demand for perceived safe-haven assets, currency uncertainty and changing expectations for US monetary policy. However, production performance depends on ore grades, recovery rates, labour costs, fuel expenses and sustaining capital.
Australia's official September quarterly outlook estimates an average gold price of US$4,400 per ounce for the third quarter of 2026 and anticipates continued firm demand in the second half of the year. These are published estimates, not guaranteed future prices.
Rare earths, graphite, cobalt, manganese and other critical minerals have additional strategic importance. Their commercial prospects depend on processing capacity, customer contracts, export restrictions and the availability of alternative suppliers.
Key Companies in Focus
1. BHP — Diversified Mining and Copper Exposure
BHP provides exposure to iron ore, copper and other major commodities. Its diversified operations make its financial performance dependent on several commodity cycles rather than a single market.
In its October 20 operational review, BHP reported that Western Australia Iron Ore (WAIO) achieved record mine and port performance during the September quarter. Consolidated copper production was 205,000 tonnes, down 4% from the June quarter, reflecting planned grade declines, maintenance and operational disruptions. The company also highlighted ongoing investment in copper and potash projects.
The key metrics to monitor are iron ore sales, copper production, unit costs, capital expenditure and project delivery.
2. Rio Tinto (RIO) — Iron Ore, Copper and Lithium
Rio Tinto combines large-scale Pilbara iron ore operations with copper assets and a growing lithium business.
Its October 14 production report recorded global iron ore sales of 90.8 million tonnes for the September quarter, up 3% year-on-year. Copper production reached 205,000 tonnes, while lithium production increased 33% year-to-date despite adverse weather affecting quarterly operations.
The company's operating diversity offers exposure to several commodity markets, but it also creates different production, development and cost challenges across its portfolio.
3. Mineral Resources (MIN) — Iron Ore and Lithium
Mineral Resources operates across mining services, iron ore and lithium, creating exposure to both established bulk commodities and battery materials.
Its October 23 quarterly update reported record mining-services volumes and record attributable lithium sales for the September quarter. The company also maintained its financial-year guidance across its divisions. These operational developments provide useful indicators of activity levels and execution across its business.
Important measures include lithium sales volumes, iron ore shipments, realised prices, operating costs, debt and capital expenditure.
4. Northern Star Resources (NST) — Gold Production and Costs
Northern Star provides a different exposure through gold mining. Its September-quarter results illustrate why production costs must be considered alongside commodity prices.
The company reported gold sales of approximately 364,000 ounces at an all-in sustaining cost (AISC) of A$3,217 per ounce. Quarterly net mine cash flow was A$210 million, while cash and bullion totalled A$1.2 billion at September 30. Its FY2027 production guidance remained unchanged.
Monitoring production volumes, AISC, processing-plant commissioning and operating cash flow helps explain how gold-price movements translate into company-level financial outcomes.
Future Outlook
The coming months will test the resilience of Australia's mining sector as individual commodities respond to different market forces.
Key developments to monitor include:
- Iron ore: Chinese steel production, port inventories, Simandou's ramp-up and negotiations between Chinese buyers and Australian producers.
- Lithium: Battery-storage demand, electric-vehicle production, Chinese inventory data and the pace of supply returning to the market.
- Copper: Mine disruptions, electricity infrastructure spending, data-centre development and international trade policy.
- Gold: US interest-rate expectations, currency movements, central-bank demand and miners' operating costs.
- Critical minerals: Government funding, strategic supply agreements, processing capacity and progress towards commercial production.
The broader picture is one of divergence rather than a uniform mining-sector trend. Iron ore faces supply-related pressure, lithium remains sensitive to inventory and production changes, copper has structural demand drivers, and gold miners must balance commodity prices against operating costs.
For ASX sector analysis, quarterly production reports, realised commodity prices, cash flow, capital expenditure and balance-sheet conditions will remain essential measures of how these different trends affect individual businesses.
Disclaimer
General Information & Educational Purposes Only: This article is general information and for educational purposes only. It does not take into account your personal objectives, financial situation or needs, and does not constitute financial product advice. It is not personal financial advice and should not be relied upon as such. Past performance, examples, historical data, or projections are not indicative of future results. You should consider whether it is appropriate for you, read the relevant Product Disclosure Statement (PDS), and seek independent professional advice from a licensed adviser before making any investment decision. While we endeavour to ensure accuracy, we make no representations or warranties regarding completeness or reliability. Data may include third-party sources including company announcements and regulatory filings which we do not independently verify. To the maximum extent permitted by law, Falkonanalytics excludes all liability for reliance on this information.